2023 survey results
This page outlines the results of the 2023 Web-Needs survey, which was sent to 6 email lists in January with a runtime of 3 weeks. The survey was developed by DoIT Web Platforms & Services in collaboration with multiple campus partners to learn more about the people who do website work on campus and the challenges they face.
The survey was sent to the following email lists:
- Campus Communicators
- Tech Partners
- Web Hosting
- WiscWeb
- Design Community
- Distributed Developers
Have suggestions for another list to include? Contact us.
Please note: Survey results are aggregated and anonymous to protect identities.
Respondent information
206 people from UW—Madison participated in the 2023 survey. Respondents came from 40 different units and groups across campus.
Campus unit or department
What unit or department do you work for on campus? (n=191)
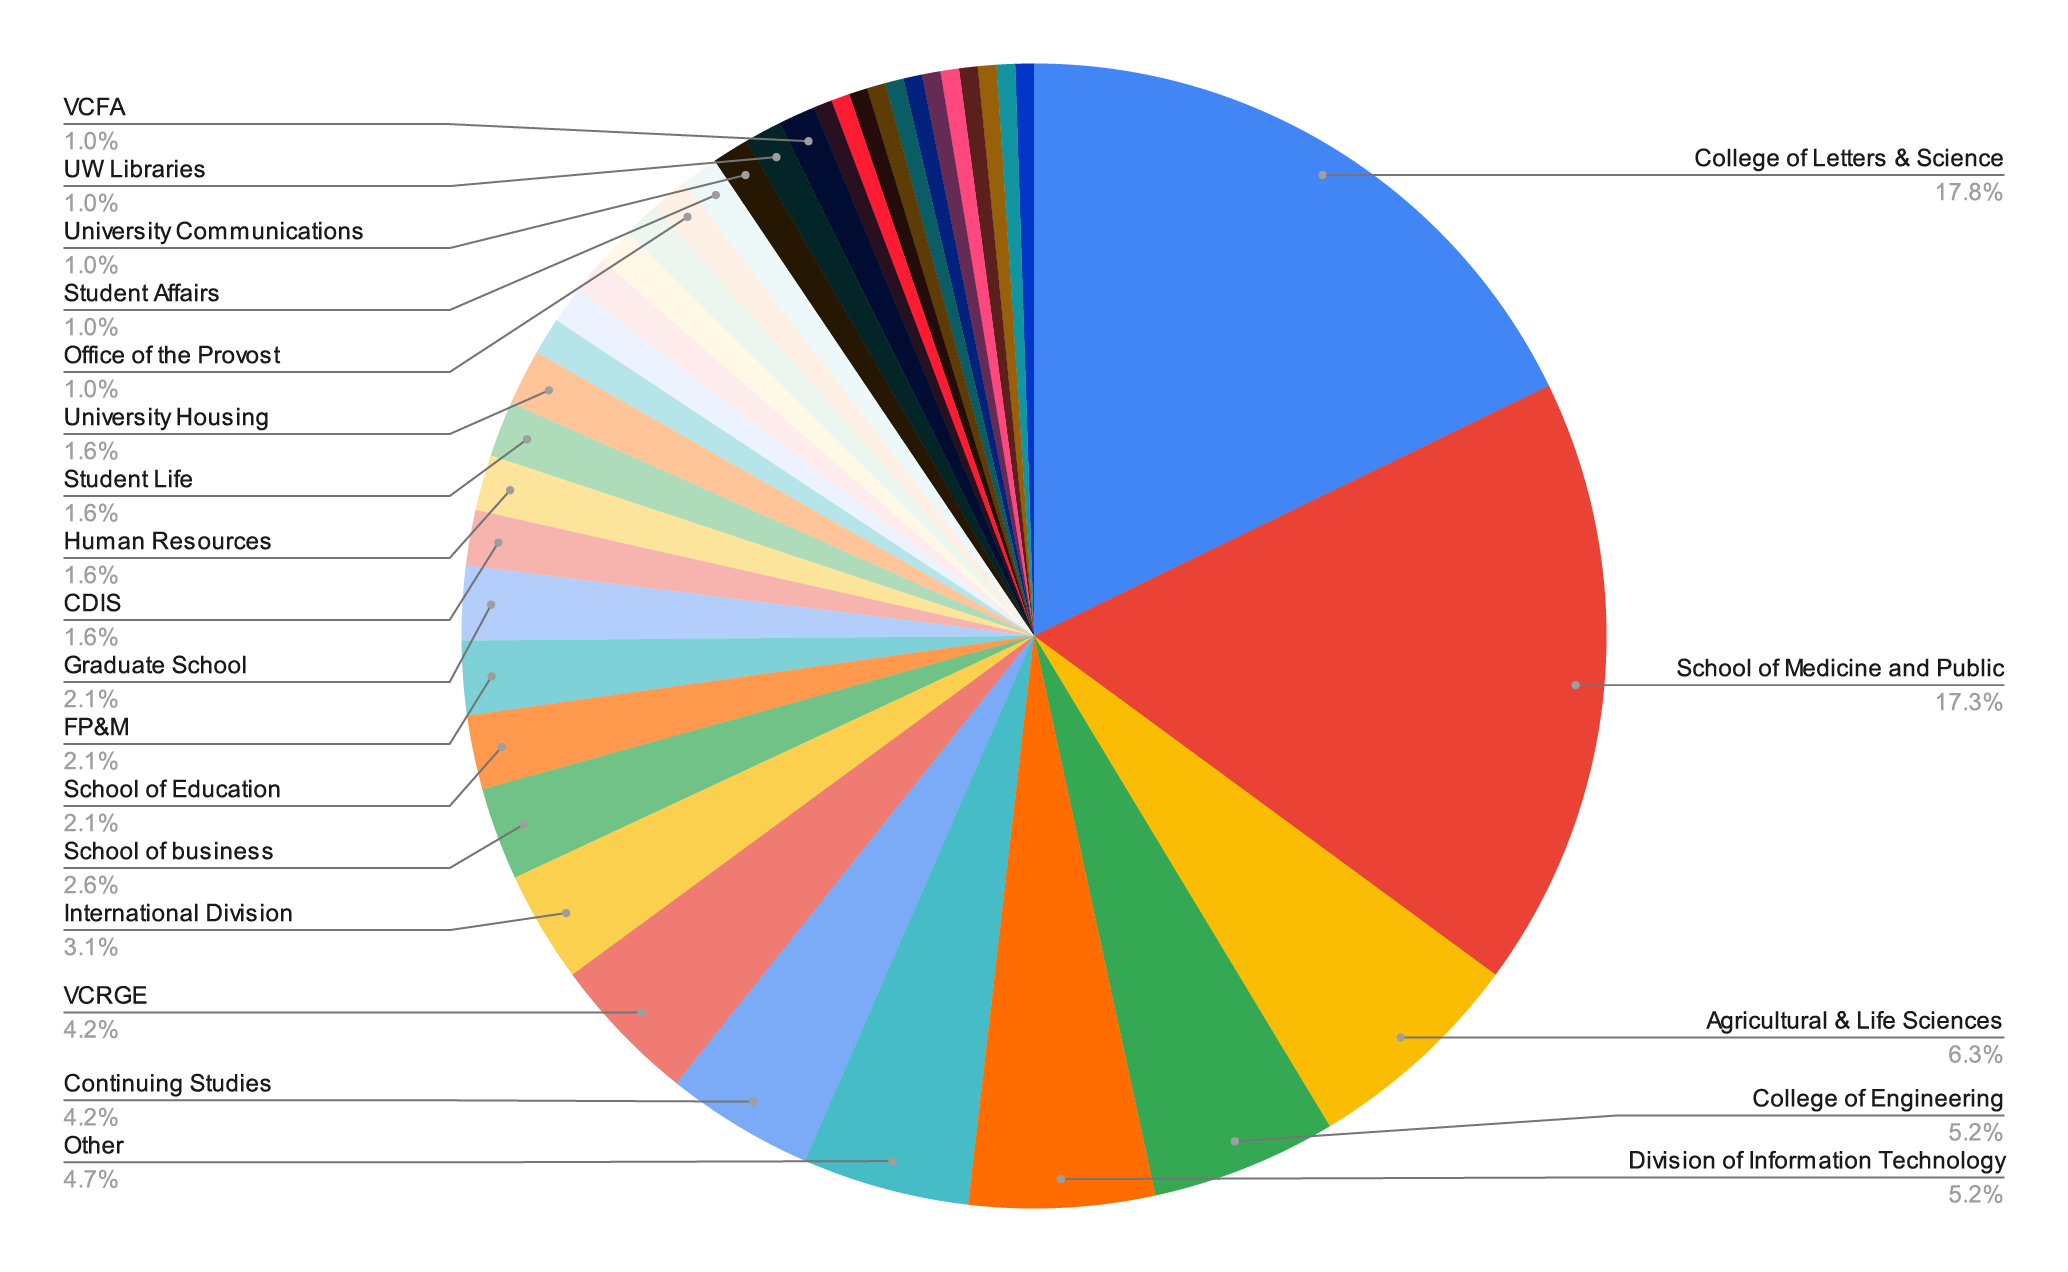
Chart summary
The top 5 groups with the highest percentage of responses include…
- College of Letters & Science (17.8%)
- School of Medicine and Public Health (17.3%)
- College of Agricultural & Life Sciences (6.3%)
- College of Engineering (5.2%)
- Division of Information Technology (5.2%)
Acronyms:
- VCFA: Vice Chancellor for Finance and Administration
- VCRGE: Vice Chancellor for Research and Graduate Education
- CDIS: School of Computer Data & Information Sciences
- FP&M: Facilities Planning and Management
Job category
Please select the job category that most aligns with your role (n=206)
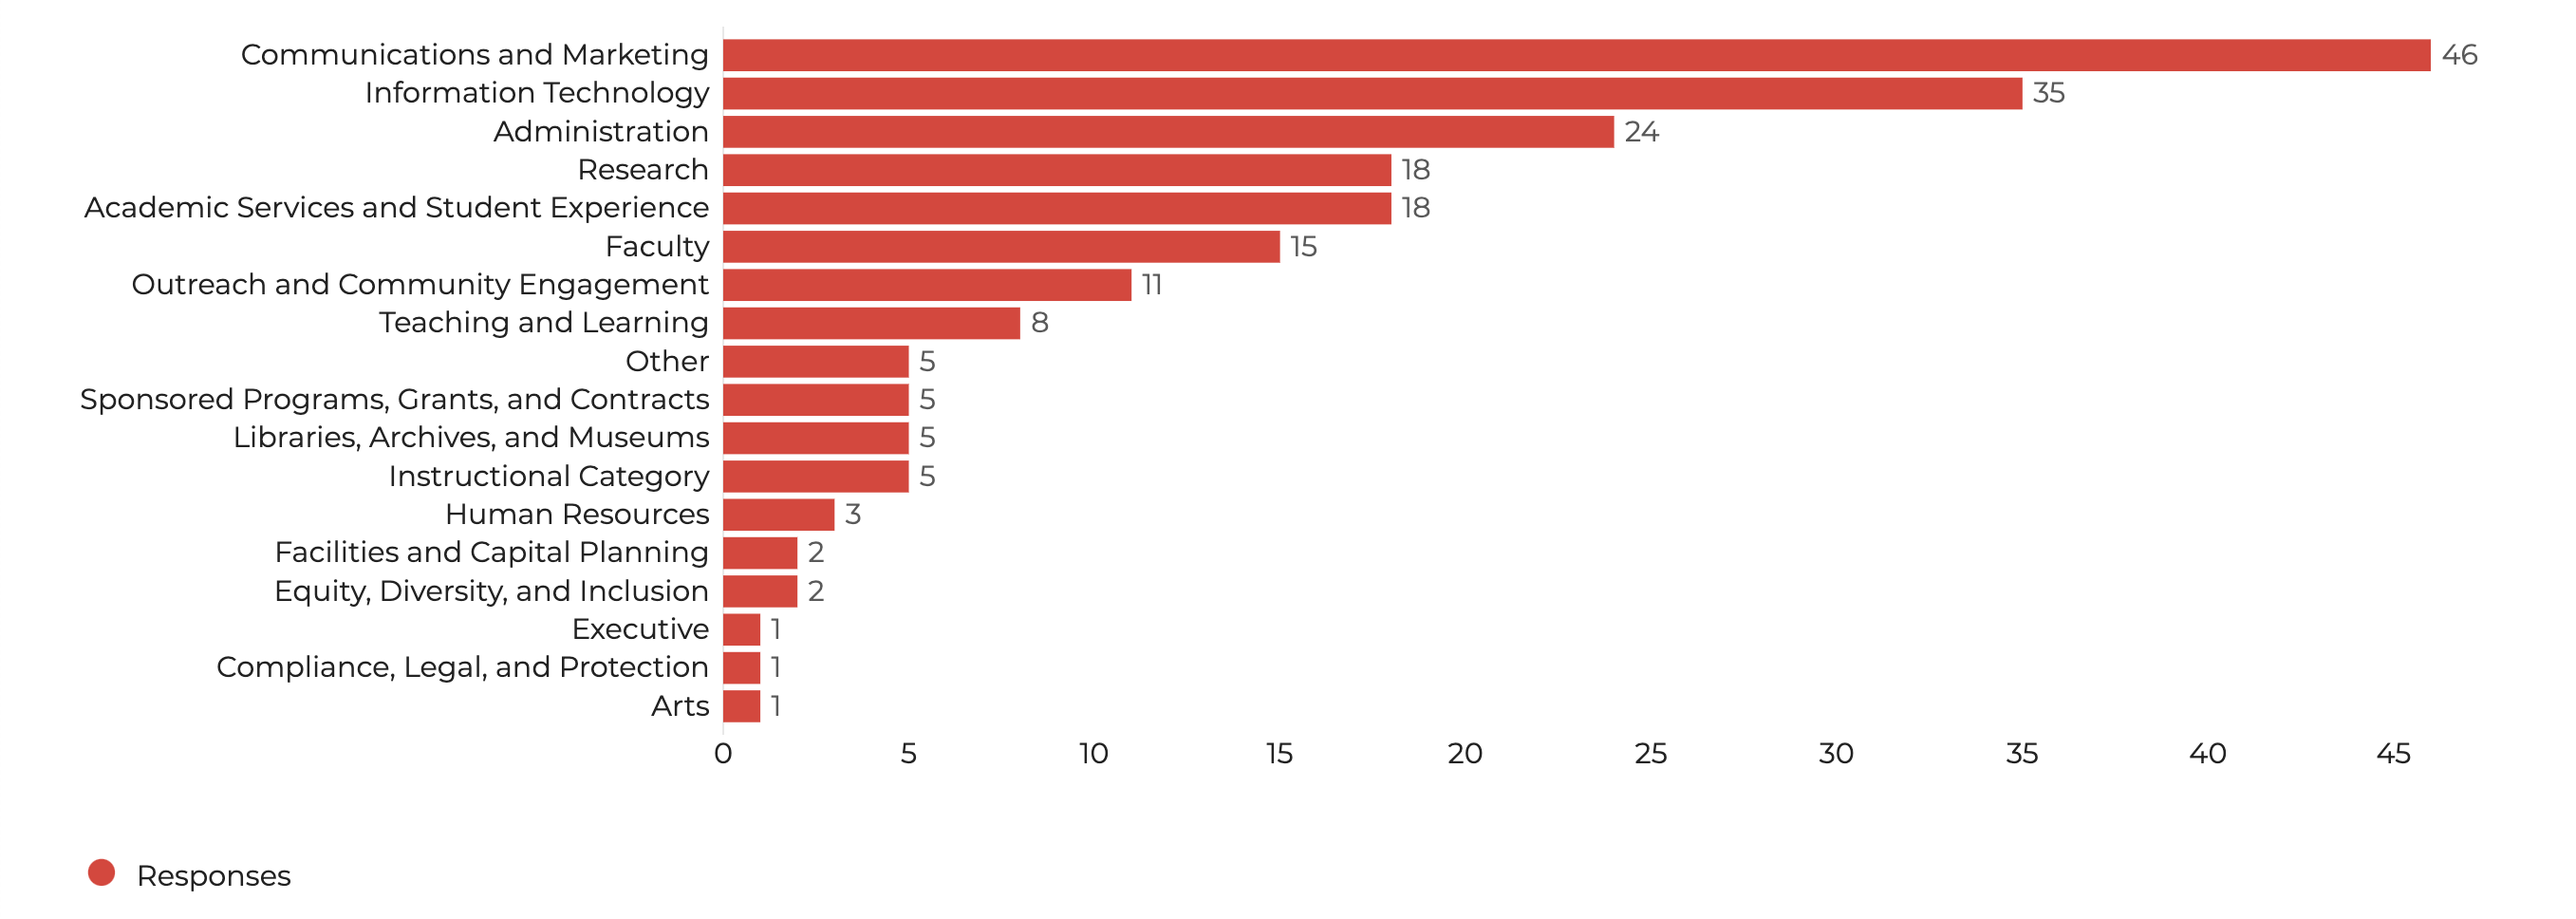
Chart summary
The top 5 job categories include…
- Communications and Marketing (46 people)
- Information and Technology (35 people)
- Administration (24 people)
- Research (18 people)
- Academic Services and Student Experience (18 people)
Web team size
Please select the job category that most aligns with your role (n=206)
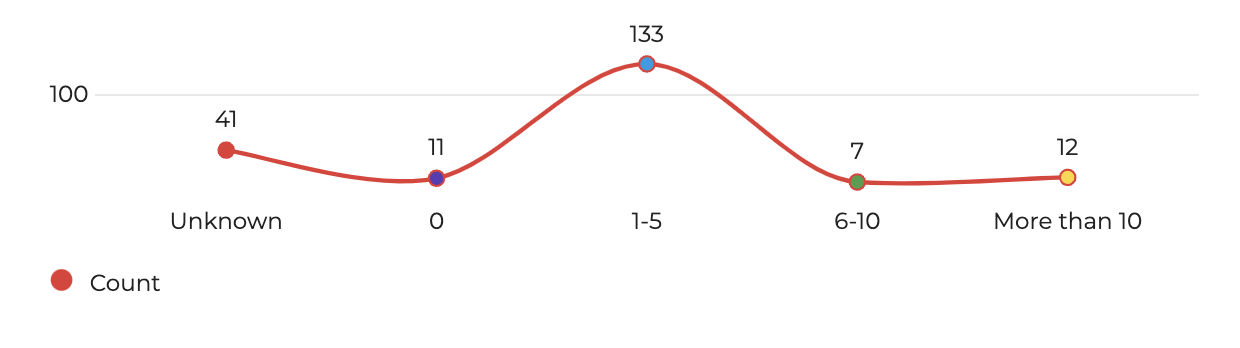
Chart summary
Below includes the web team size followed by the number of people who chose that selection
- Unknown (41 people)
- Zero / No team (11 people)
- Ranging from 1 to 5 (133 people)
- Ranging from 6-10 (7 people)
- More than 10 (12 people)
Hosting and CMS tools
We asked users about what services they use to host their websites and applications, as well as what content management systems (CMS) they use (WordPress, Drupal, Magento, etc). CMS software lets you build a website without needing to write code from scratch.
Web hosting services
Which hosting services do you currently use? Please check all that apply (n=202)
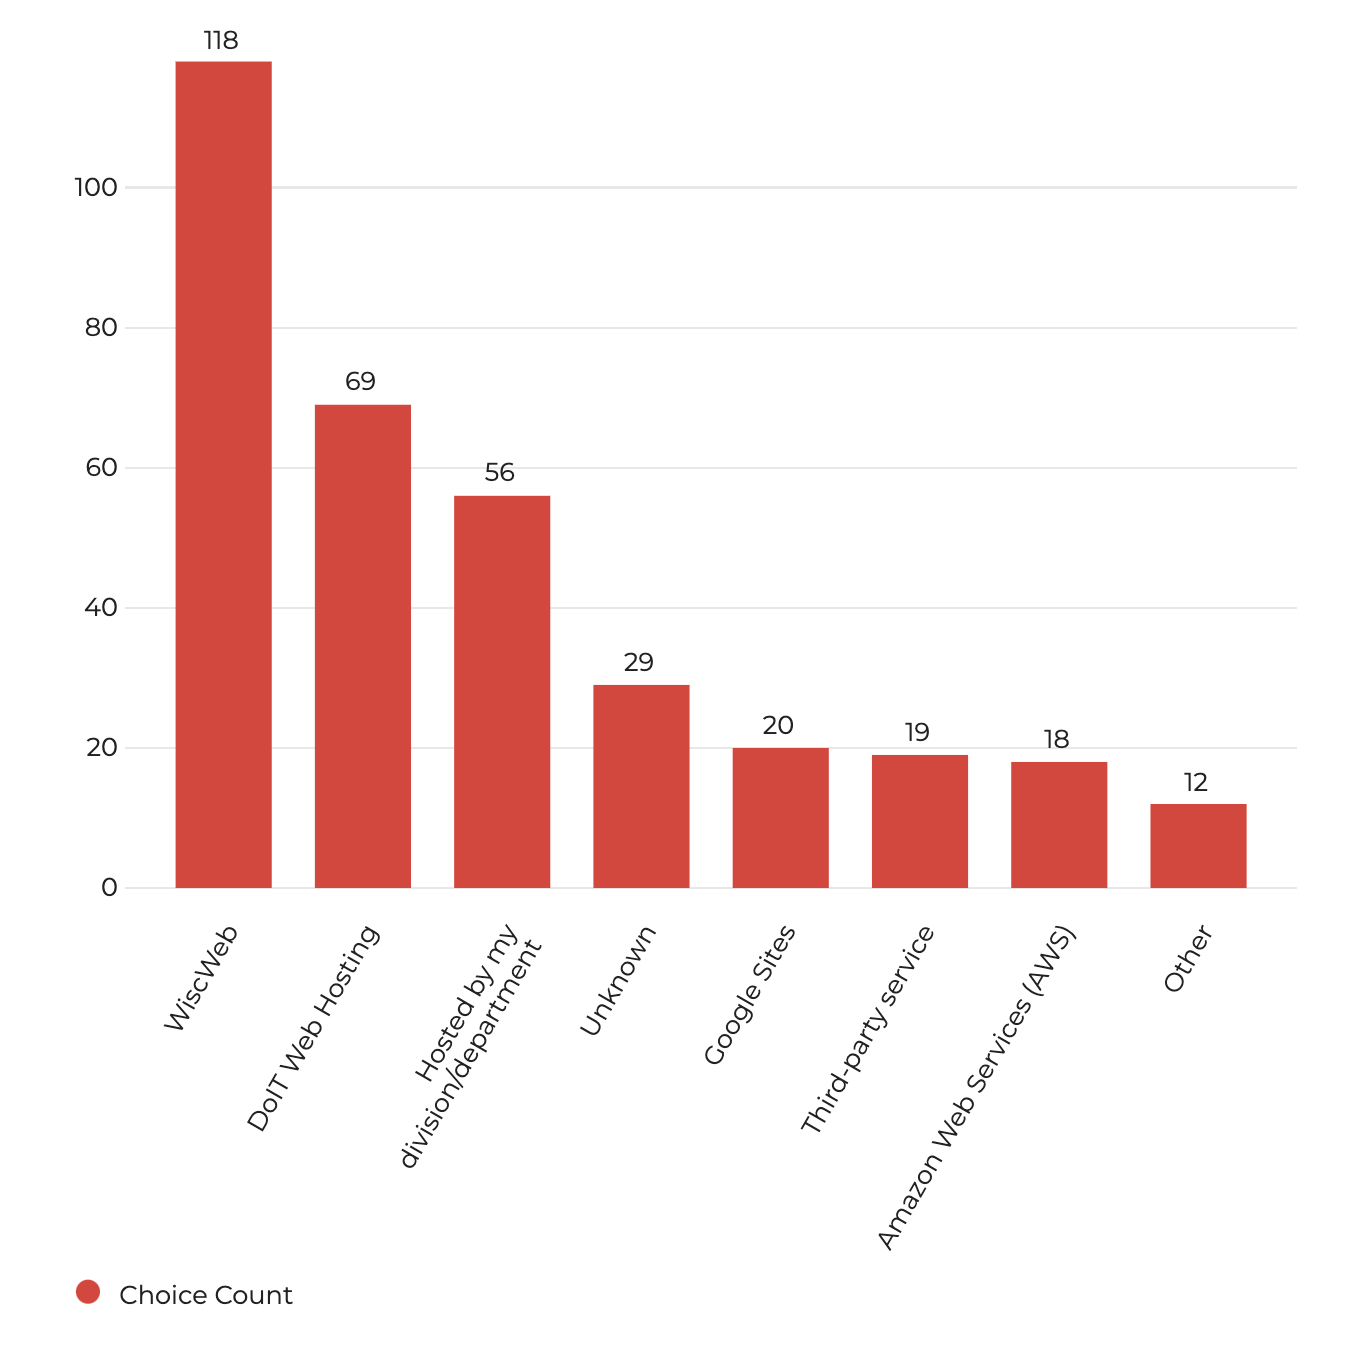
Below includes the name of the hosting service followed by the number of times that selection was made.
- WiscWeb (118)
- DoIT Web Hosting (69)
- Hosted by my division or department (56)
- Unknown (29)
- Google Sites (20)
- Third-party service (19)
- Amazon Web Services (AWS) (19)
- Other (12)
- UW—Madison services
- CALS web hosting (1)
- GitLab (1)
- Google Cloud Platform (1)
- ResearchDrive (1)
- SharePoint (1)
- Vendor solutions
- GitHub (1)
- Pantheon (2 people)
- Squarespace (1)
- WordPress (1); it’s unclear if the user is referring to WordPress.com hosting or WordPress as a CMS platform.
Current CMS
Which content management systems do you currently use? Please check all that apply (n=178)
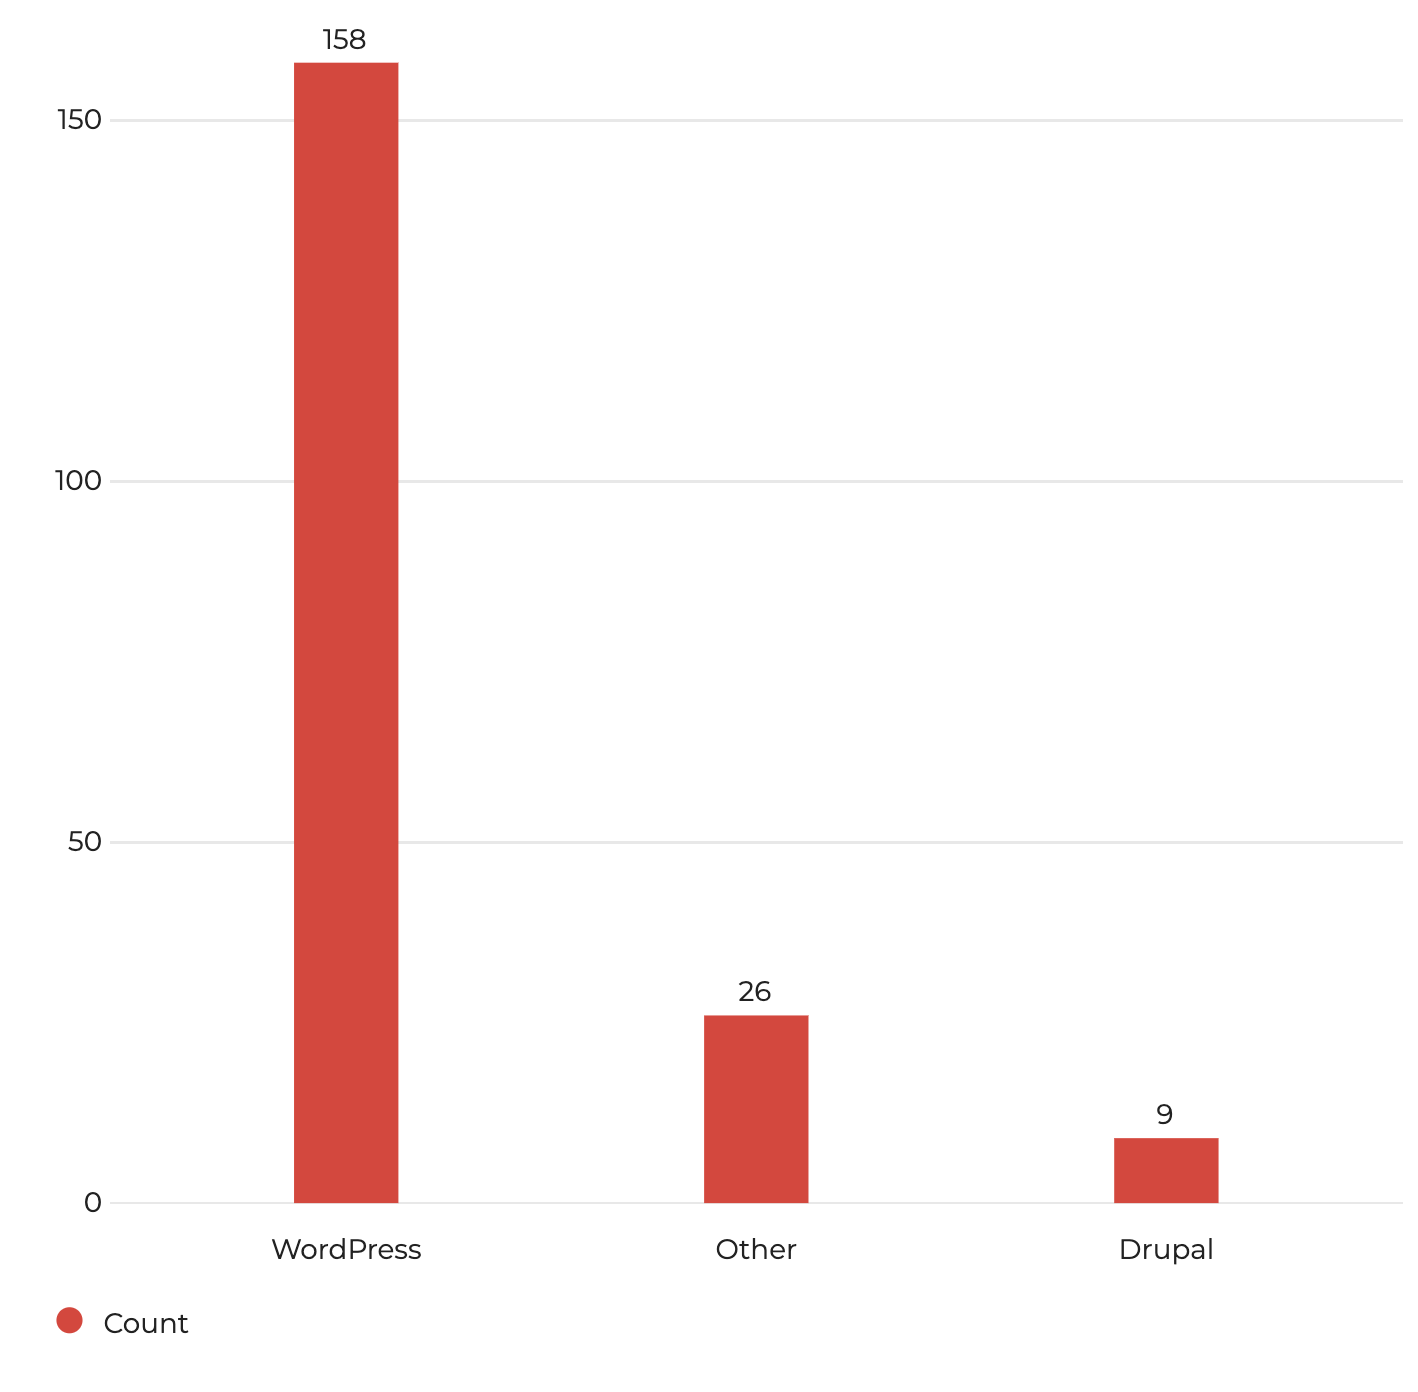
- WordPress is the leading platform with 158 selections
- Drupal received 9 selections
- 26 selections chose “Other” for their current CMS
- CMS software mentioned
- Dreamweaver (1)
- Ethos CE (1)
- Moodle (1)
- Silverstripe (1)
- Squarespace (2)
- Symbiota (1)
- UW KnowledgeBase (1)
- Wagtail (1)
- Development frameworks
- Ruby on Rails (1)
- GitLab (1)
- Hugo (1)
“WiscWeb and the DoIT Shared Hosting team are doing a great job, and the tools to create and maintain our sites have been great! I’ve had very good experience with getting new sites up and running without a hassle. The WordPress tool on Shared Hosting is also amazing…it has cut my maintenance time by 90%.”rnrn
UW Theme
The UW Theme is UW—Madison’s supported WordPress theme that offers university branding and a page builder for designing rich content layouts. The theme is available to use for anyone on a wisc.edu domain.
Customer Satisfaction Score
67.58%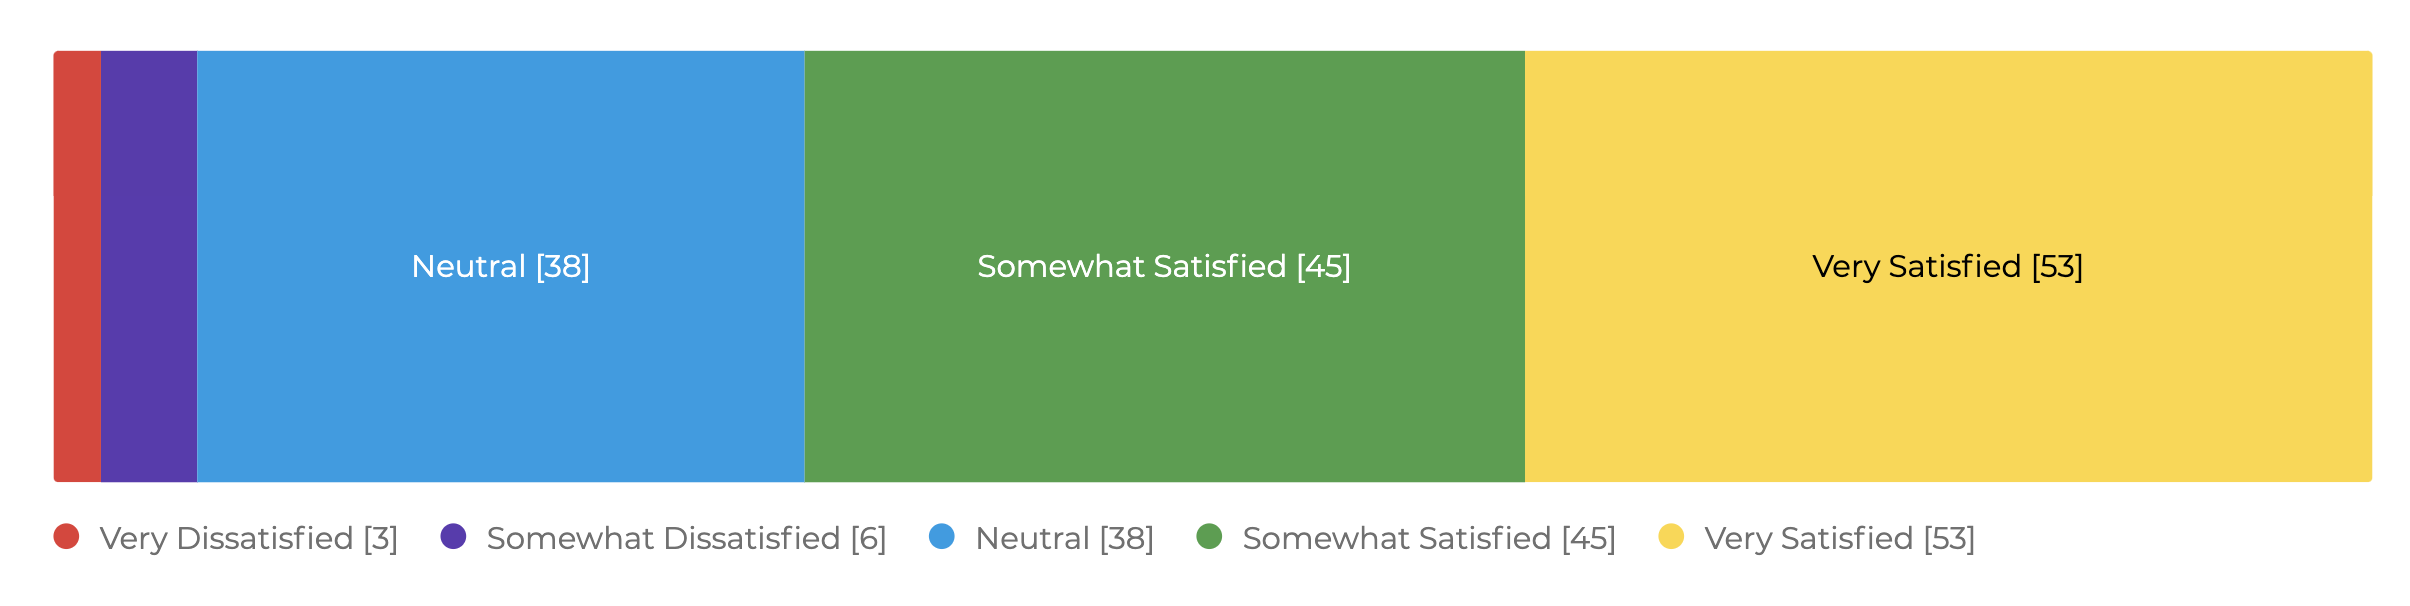
Based on a 1 to 5 satisfaction scale, the UW Theme’s CSAT score is 67.58%. CSAT is a common metric for understanding how satisfied people are with a company’s products or services. The following formula was used to arrive at a percentage score:
(Number of satisfied customers (4 and 5) / Number of survey responses) x 100 = % of satisfied customers
UW Theme satisfaction
How satisfied are you with the UW Theme for WordPress? (n=145)
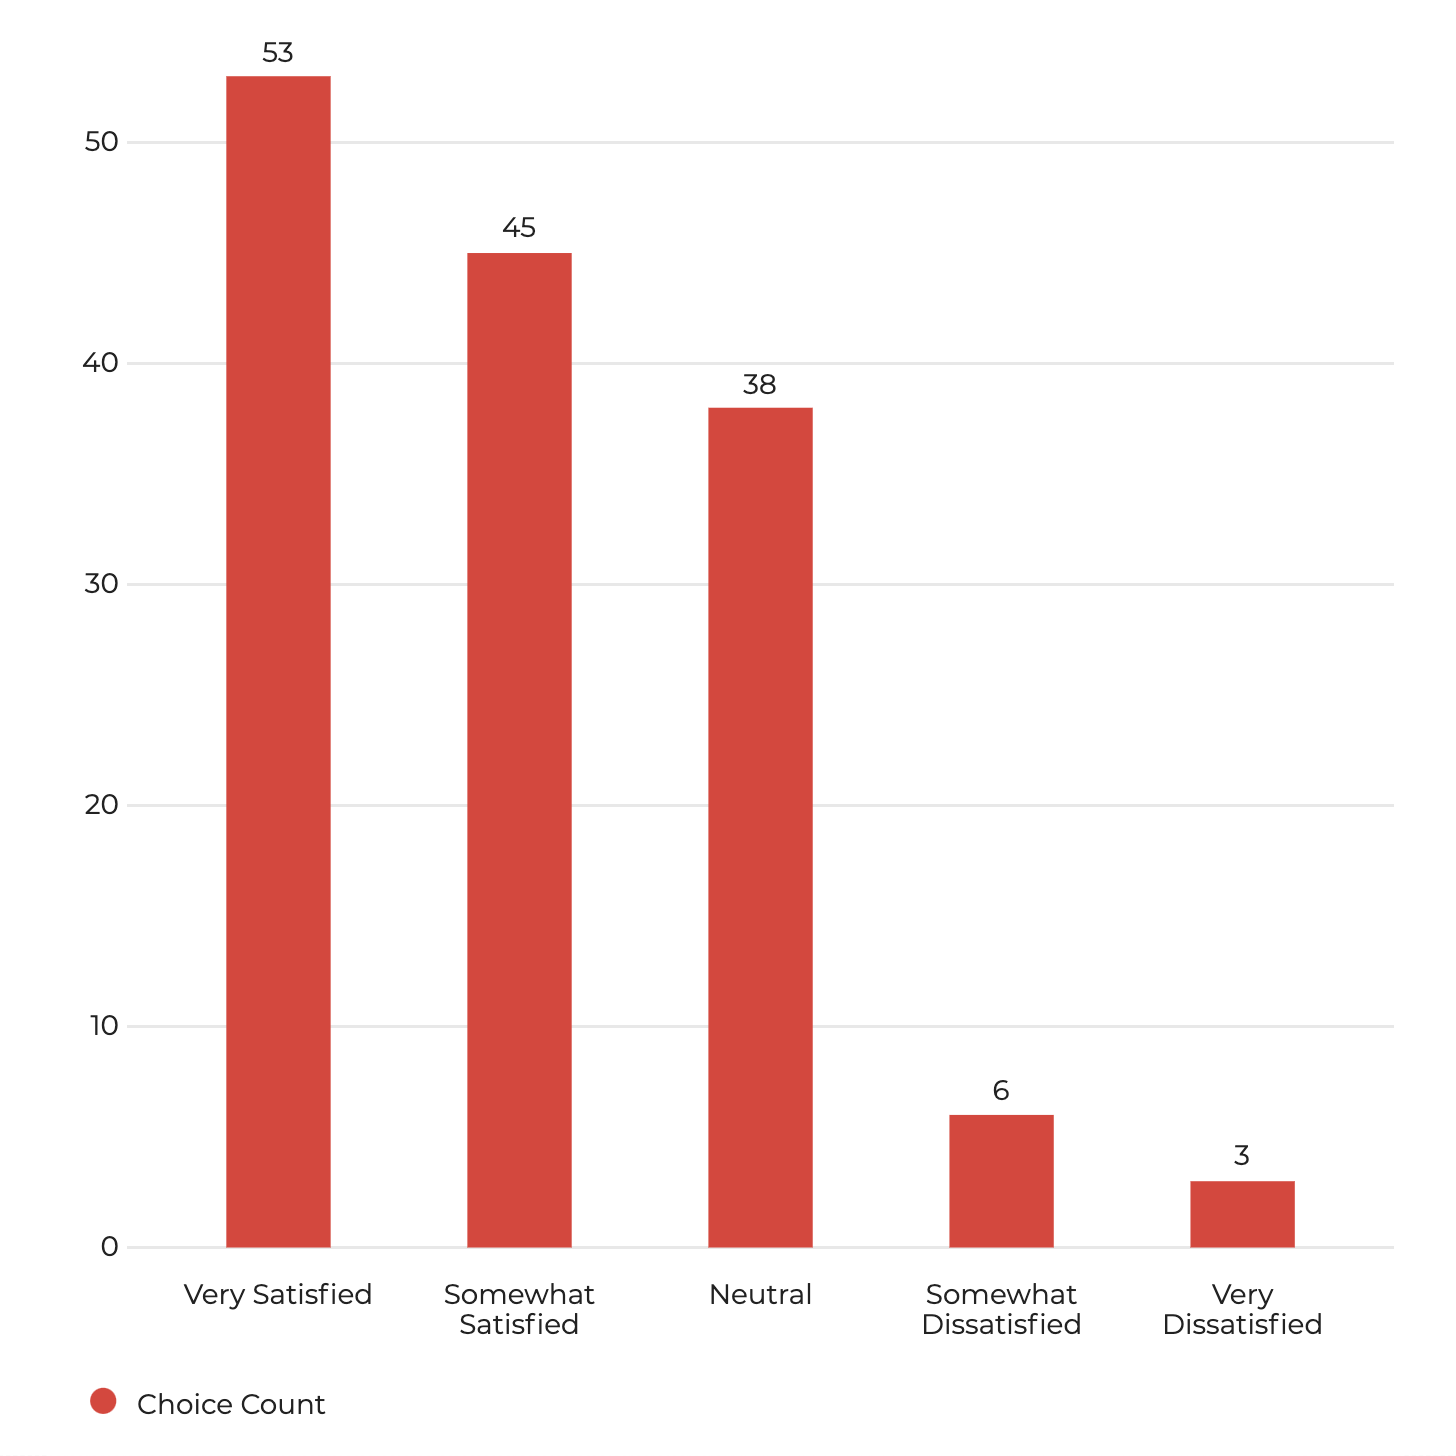
Chart summary
- Very satisfied (53 people)
- Somewhat satisfied (45 people)
- Neutral (38 people)
- Somewhat dissatisfied (6 people)
- Very dissatisfied (3 people)
Non-UW Theme users
Do you use WordPress but not the UW Theme or WiscWeb? If so, Why? (n=58)
Insights
People cited a few primary reasons for not using the UW Theme or WiscWeb. They needed…
- more design flexibility and options
- the ability to have brand independence
- functionality not currently included in the theme or service (specific plugins, integrations, etc.)
“The WiscWeb service team is fantastic. They are approachable, thoughtful in their responses, and offer helpful solutions. Truly a model for other service to emulate.”
WiscWeb
The WiscWeb WordPress service is a free, fully-supported platform for creating and maintaining sites at UW—Madison. Sites using WiscWeb are built using the UW Theme and hosted in the cloud for fast performance and high availability. Learn more about DoIT’s website publishing options and the differences between them.
User feedback
Of the 206 survey respondents, 118 people indicated that they use the UW Theme on the WiscWeb WordPress service. We’ve included a summary of the top 3 requests that users provided.
Add additional design options/variety
Users want additional design options to create more engaging content and page layouts like page templates, header/footer options, gallery layouts, etc. (25 people)
Include more plugins and integrations
Users would like a larger list of pre-vetted plugins, widget options, or better integrations with campus tools like Salesforce and Eloqua (16 people)
Allow for more flexibility and control of design
Users would appreciate more flexibility to customize and personalize their site design, and feel like the service is too “locked down” (12 people)
New features
Feedback from this survey has already helped WiscWeb make improvements to the UW Theme and WiscWeb service overall, as well as prioritize user wants/needs for the future.
Updates and features added
Since the survey, WiscWeb has released 10+ new features, updates, and fixes to the UW Theme, including updating all sites to use the new Red Hat fonts. Visit the theme’s changelog for a summary of updates.
Submit a feature request
WiscWeb captures feature requests in a tool called GitLab and regularly reviews them. You can view and upvote requests already submitted from others! Share your ideas and help improve the service.
Additional support
In order to understand where there might be gaps in campus website offerings, we asked about where people needed additional support when creating and maintaining websites.
Support for additional services
Which of the following services would you like to see receive more support at the university? Please check all that apply (n=192)
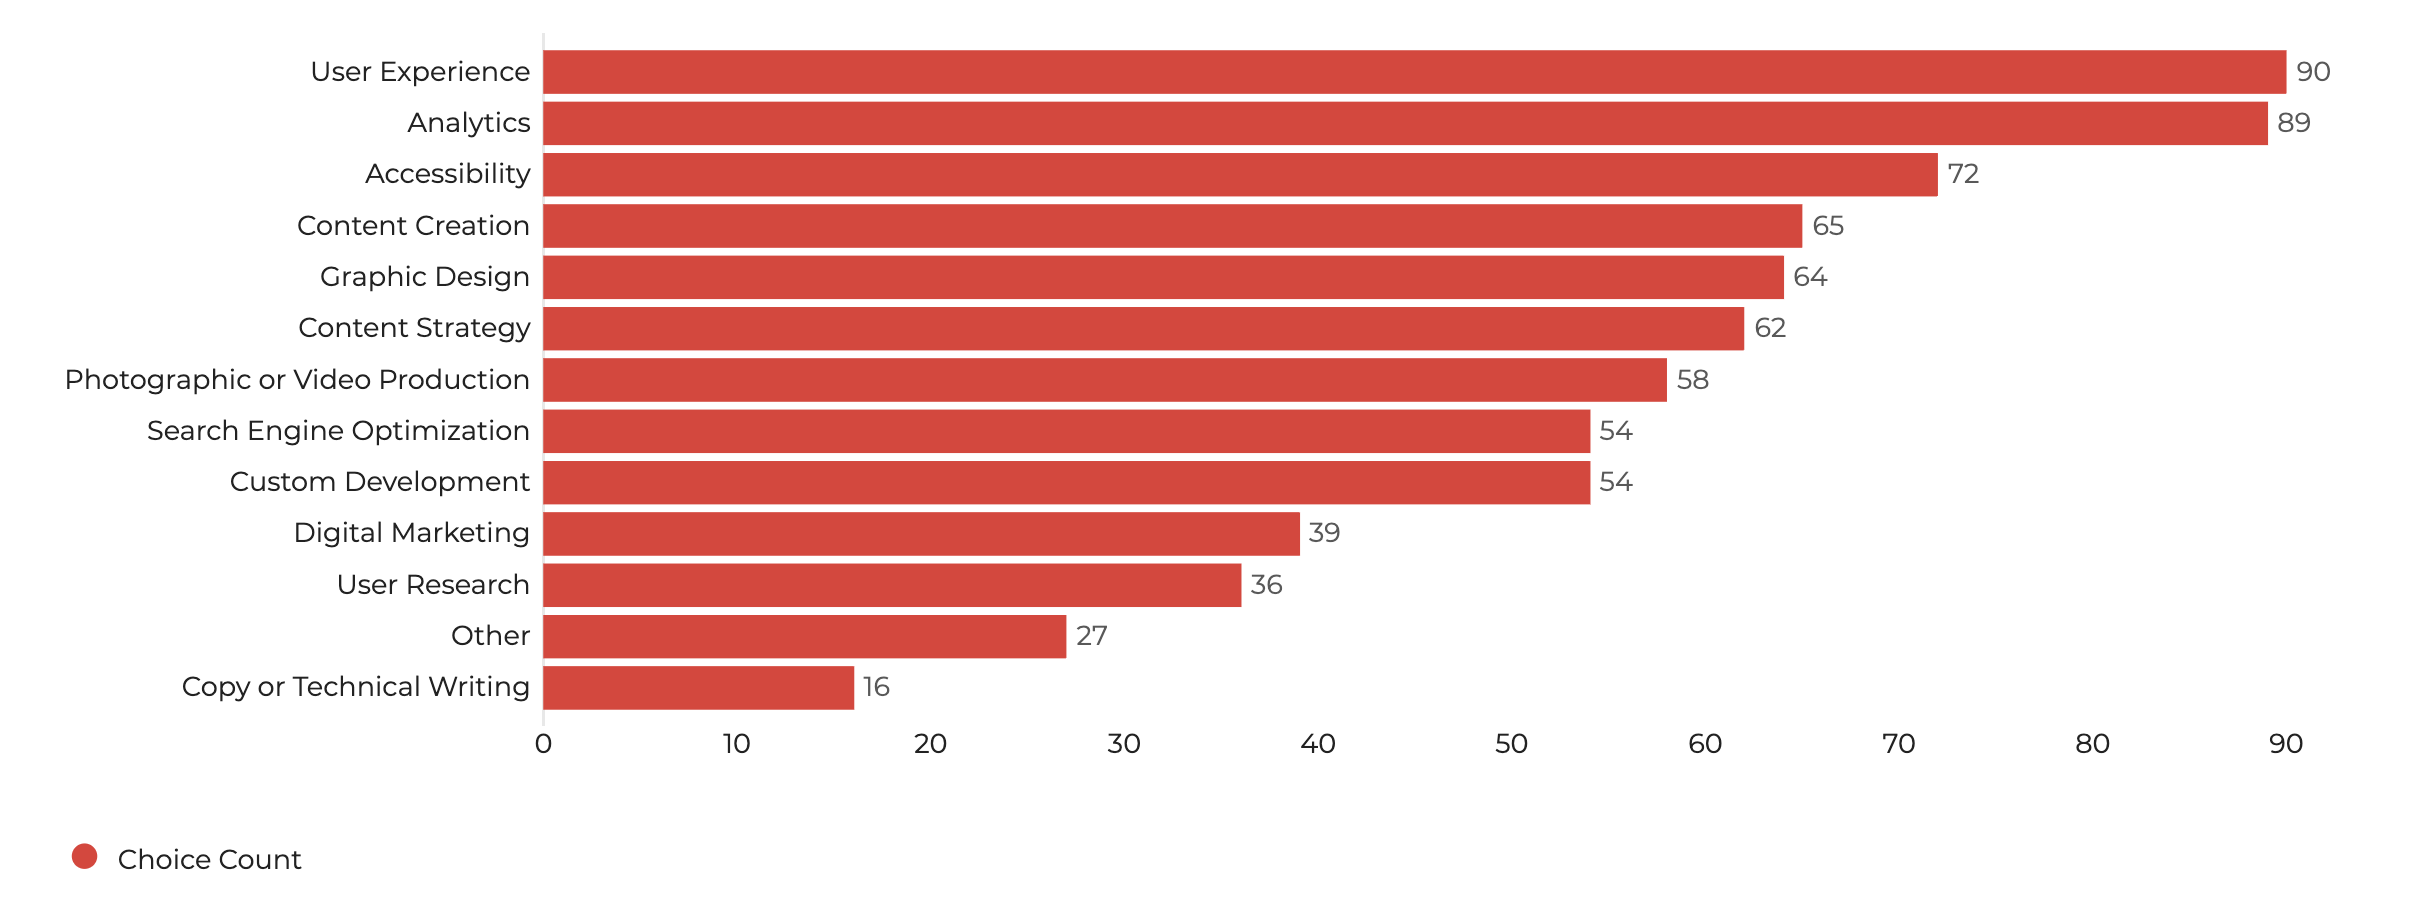
Chart summary
The 5 additional services that users chose most often were…
- User Experience (90)
- Analytics (89)
- Accessibility (72)
- Content Creation (65)
- Graphic Design (64)
User interviews
Didn’t get to take the survey?
We’d still love to hear from you! When you sign-up, a member from the project team may reach out for a quick 15-30 minute virtual interview to learn more about your experience building websites at UW—Madison.
Follow-up interview
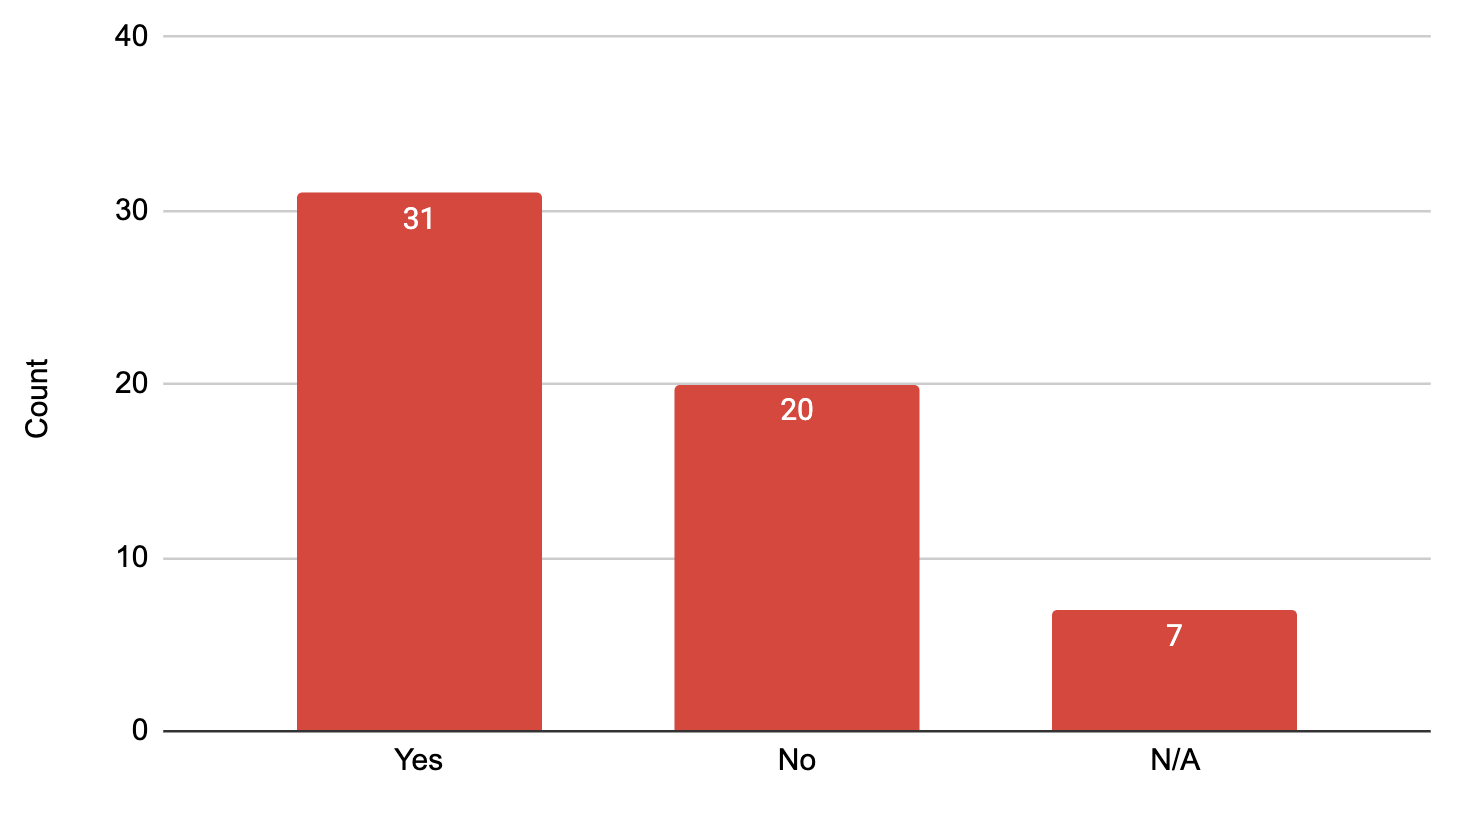
Can we contact you with additional questions regarding your responses? (n=193)
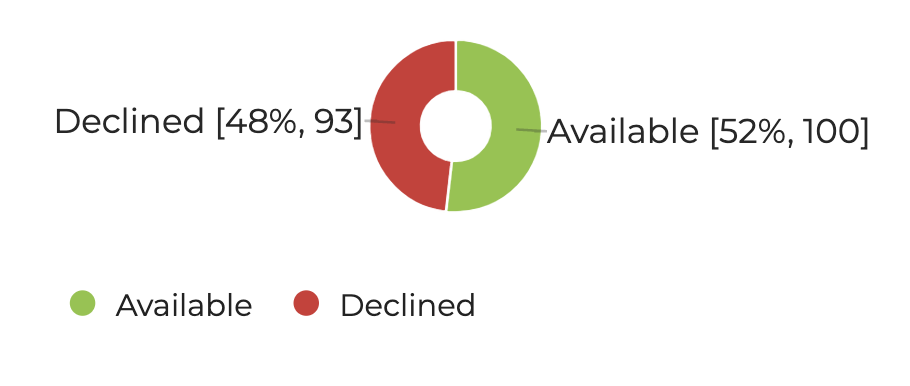
Chart summary
- 52% of survey respondents agreed to an interview
- 48% of survey respondents declined an interview